Analyzing heap memory usage with Valgrind Massif
Valgrind Massif analyzes a program's heap usage by taking heap snapshots as the program runs, then outputs the snapshot data when the program terminates. The IDE visually presents the data by graphing the heap usage over time.
If your target image isn't configured to include the valgrind binaries and libraries, the IDE attempts to upload these components when you launch an application with a Valgrind tool enabled. For this to work, the target must have a writable filesystem.
- In the launch bar, expand the Launch Configuration dropdown (which is in the middle) and select the project that you want to analyze.
- In the Launch Target dropdown (on the right), select the target for running your application.
- In the Launch Mode dropdown (on the left), select Memory.
-
Click the Edit button (
 )
on the right of the Launch Configuration dropdown.
)
on the right of the Launch Configuration dropdown.
- In the configuration editor window, access the Valgrind controls by clicking the Memory tab on the right and then the Valgrind radio button near the top of this tab.
- Select Massif from the Tool to run dropdown.
- Optional:
You can change any settings to customize what gets reported in the Valgrind results.
The Massif tab lets you specify how many heap snapshots are taken and how the captured data are presented.
- Click OK to save the configuration changes and close the window.
-
In the launch bar, click the Memory button
(
 ).
).
The IDE switches to the QNX Analysis perspective. If necessary, the IDE first builds the binary before uploading it to the target. To analyze the application, the IDE instructs Valgrind to execute the uploaded binary with Massif instrumentation. Then, it creates a session for storing the Valgrind results; this new session is displayed in the Analysis Sessions view. When the program terminates, Valgrind writes the results to a log file, which the IDE copies into the directory for the new session.
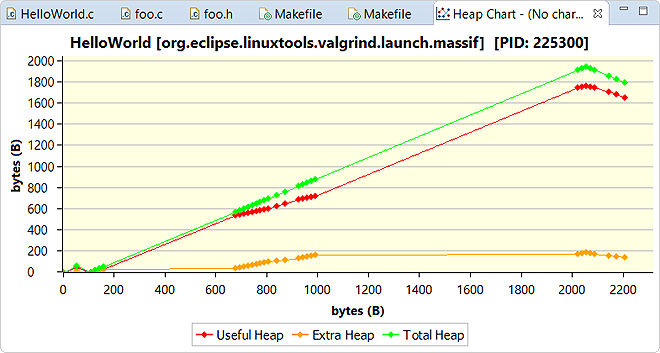
The chart plots the heap size along the vertical axis and the execution progress along the horizontal axis. For the execution progress, the metric used is determined by the Time unit field.
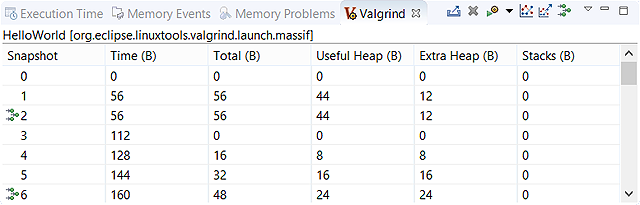
Some heap snapshots are detailed, meaning they contain information about where the current blocks were
allocated. The rows for these snapshots are indicated with the heap tree icon (![]() ). Double-clicking in one of these rows displays a tree-like
listing of allocation sources, as illustrated and explained in
). Double-clicking in one of these rows displays a tree-like
listing of allocation sources, as illustrated and explained in Finding unused memory with Valgrind Massif
.