Finding memory corruption with Memory Analysis
You can enable error checking for Memory Analysis and launch an application to find cases of memory corruption, such as bad pointer values given to C library functions as well as out-of-bounds data writes. The Memory Analysis tool detects this from the data sent by the debug allocation library (librcheck).
- In the launch bar, expand the Launch Configuration dropdown (which is in the middle) and select the project for which you want to check memory.
- In the Launch Target dropdown (on the right), select the target for running your application.
-
In the Launch Mode dropdown (on the left), select Check.
Note:Although you can select Debug mode and manually enable Memory Analysis in the launch configuration, we recommend that you don't run this tool at the same time as the GDB debugger because the setup is more complicated. If you absolutely have to run both tools concurrently, you must follow the steps given in
Running Memory Analysis and the GDB Debugger concurrently
instead of the remaining steps given here. -
To confirm that Memory Analysis is the active tool or to adjust how it checks for memory errors,
you must examine the launch configuration. To do this:
-
Click the Edit button (
 ) on the right of the Launch Configuration dropdown.
- In the configuration editor window, click the Check tab on the right to access the tool controls.
- Ensure that the Memory Analysis radio button is selected, then uncheck the Record memory allocation/deallocation events box in the Memory Tracing panel.
- In the Memory Errors panel, you can enable or disable specific memory checks based on what types of problems you want to look for.
- Click OK to save the configuration changes and close the window.
-
Click the Edit button (
-
In the launch bar, click the Check button
(
 ).
).
The IDE switches to the QNX Analysis perspective. If necessary, it first builds the binary. Then, the IDE uploads the binary and starts running it on the target, with librcheck loaded. When this happens, a new session is created for storing the data produced by the librcheck library; this session is displayed in the Analysis Sessions view.
The Memory Analysis tool lists corruption and other memory errors in the Memory Problems view, which is displayed at the bottom. By default, errors for the entire program are listed but you can expand the Analysis Sessions entry and click a program component (e.g., process, thread) to show only its errors.
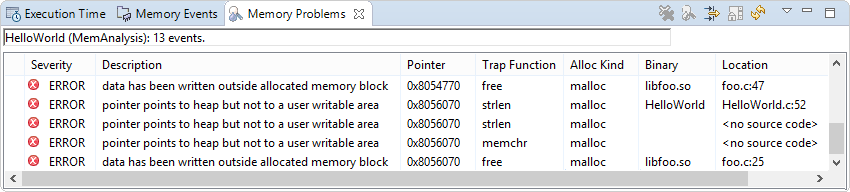
For shared libraries, you should see location information for errors that occurred in their functions. If you don't see this information, you must manually define the library paths. The Memory Analysis reference explains all error fields and messages.
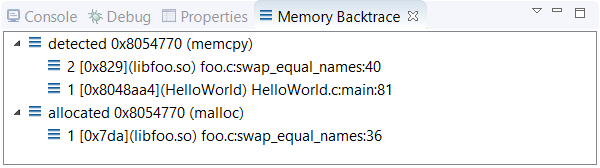
You can click an error to see stack traces of the code that allocated the memory and the code that detected its
corruption. These stack traces are shown in the Memory Backtrace view displayed in the lower left
area. The depth of the detected
call chain is restricted by the Limit back-trace depth to
field found in the Memory Errors panel.
The depth of the allocated
call chain is based on the field with the same name but found in the
Memory Tracing panel.
If you double-click an error in Memory Problems or a stack frame in Memory Backtrace, the IDE opens the source file at the indicated line (when source file information is available). This feature lets you quickly find where a memory block was allocated or corrupted.